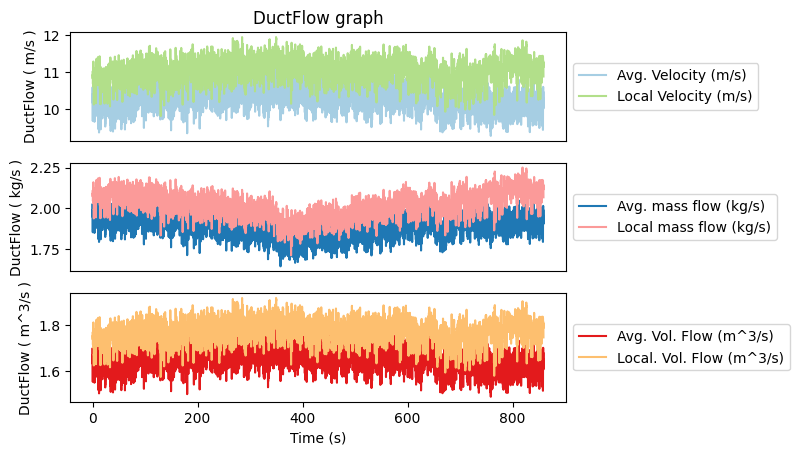
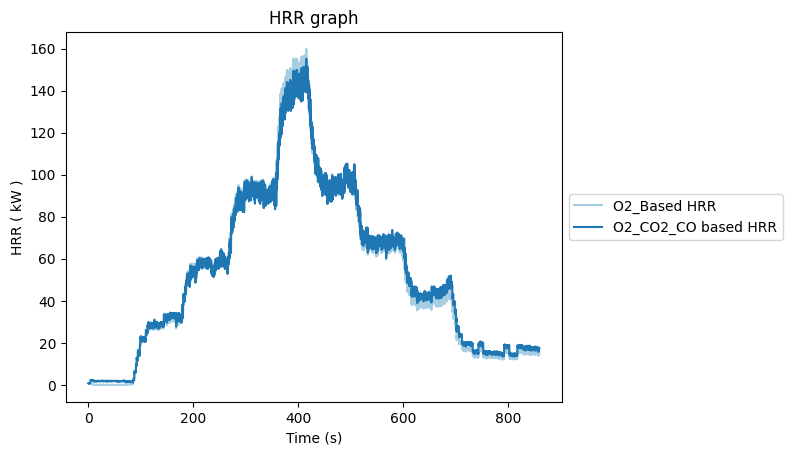
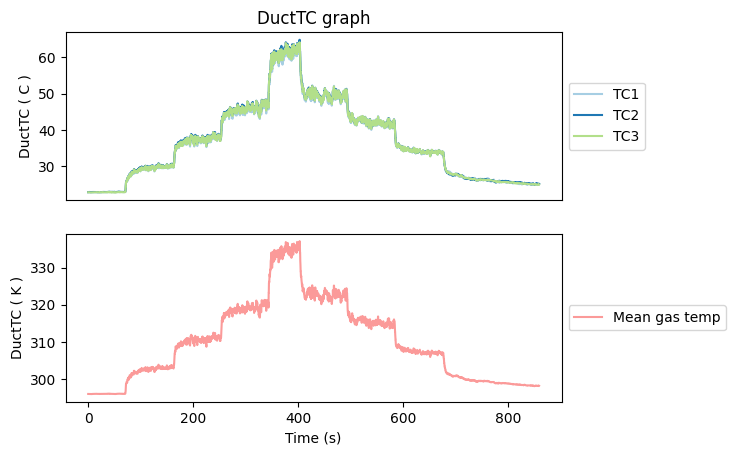
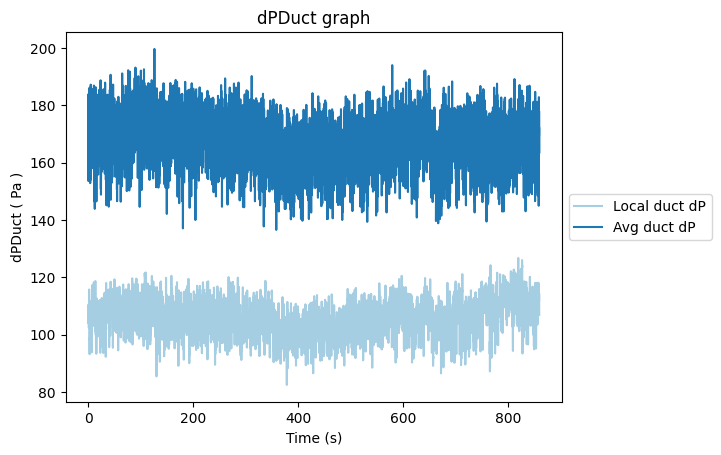
Example: Post-processed data plots
This file shows how the PostProcessData results would ideally look like
Imports
Importing the packages to plot the processed data
import numpy as np
import matplotlib.pyplot as plt


# print(plt.style.available)
plt.style.use('seaborn-v0_8-pastel')
def plot_collected(PPData):
    for _,chart_df in PPData.All_chart_info.group_by(["Chart"]):
        # print(chart_df, chart_df.select("Label")[0].item(), PPData.df_processed.columns)
        if not chart_df.select("Label")[0].item() in PPData.df_processed.columns:
            continue
        _,axes = plt.subplots(chart_df.select("Layout")[0].item())
        if not isinstance(axes,np.ndarray): # If it is only a single axis
            axes = [axes]
        chart_nos = int(chart_df["Layout"][0]) - 1
        colors = plt.get_cmap("Paired",10)
        colors = [i for i in colors.colors]
        colors = iter(colors)
        for row in chart_df.iter_rows(named=True):
            plot_pos = int(row["Position"])-1
            axes[plot_pos].plot(PPData.df_processed.select("Time"),PPData.df_processed.select(row["Label"]),label=row["Legend"], c= next(colors))
            axes[row["Position"]-1].set_xlabel("Time (s)")
            axes[plot_pos].set_ylabel(row["Chart"]+" ( "+row["Processed_Unit"]+" )")
            if not plot_pos == chart_nos:
                axes[plot_pos].get_xaxis().set_visible(False)
            if plot_pos == 0:
                axes[plot_pos].set_title(chart_df["Chart"][0] + " graph")
            axes[plot_pos].legend(loc='center left', bbox_to_anchor=(1, 0.5))
    plt.show()
    return
Collecting and post processing data
Based on the data, config file, and a formulae file in tests.
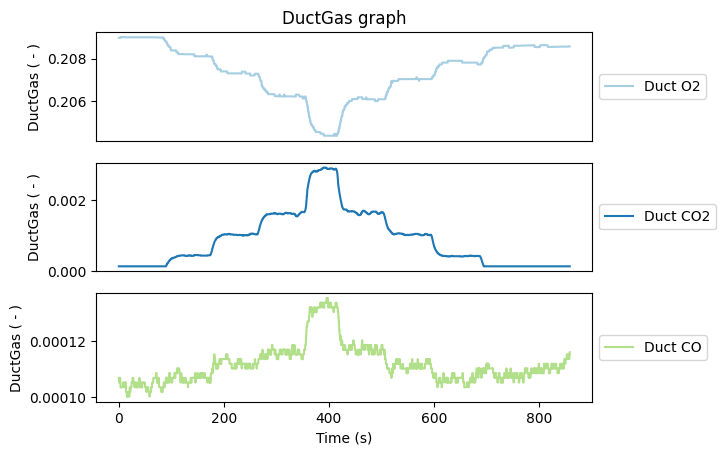
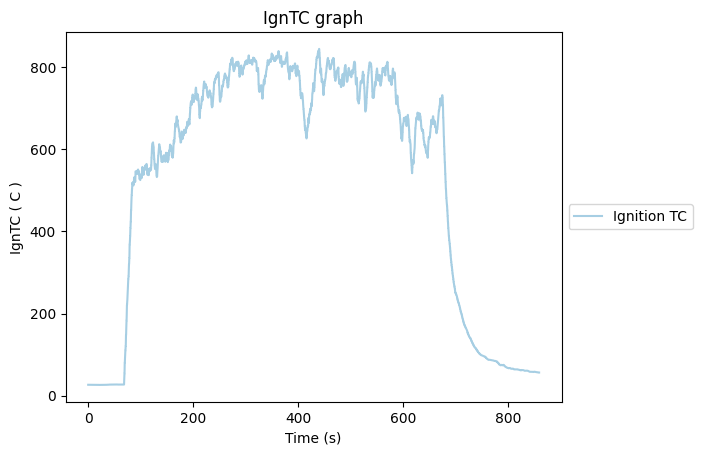
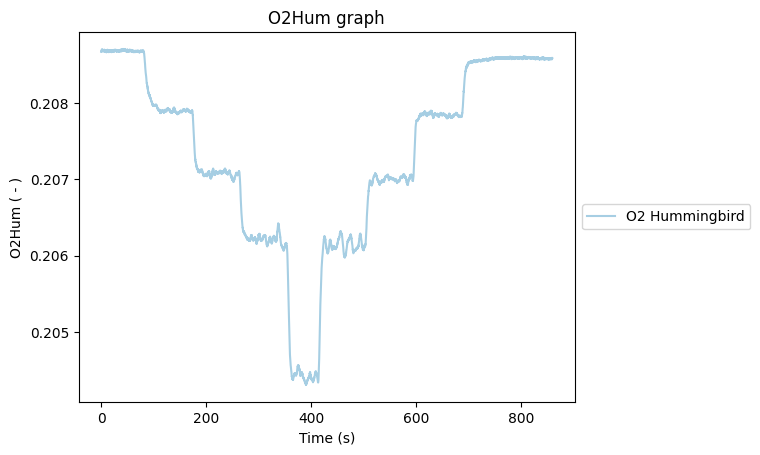
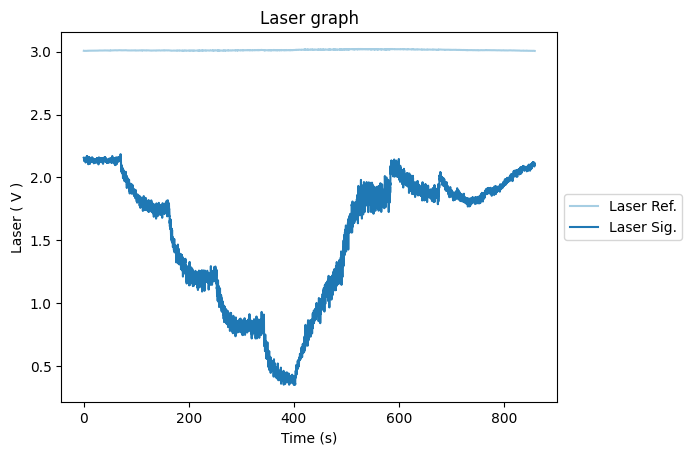
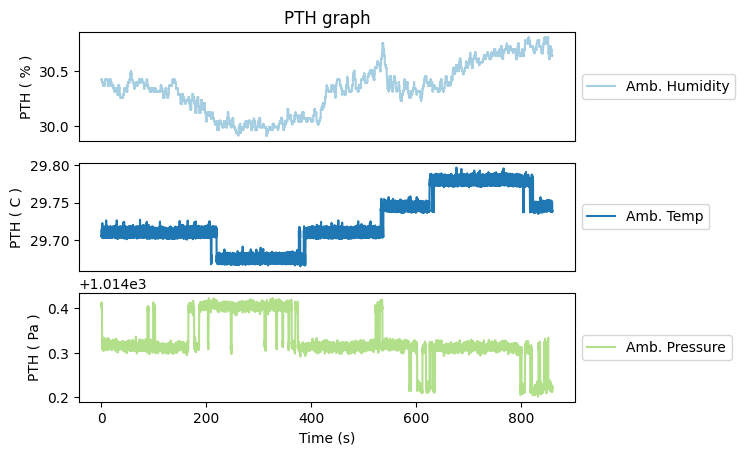
Note: The plots generated below are only for example. These are not the final plots one should rely on. This is especially true when you need to correct the collected data by constructing a baseline to consider drifting of some sensors (example oxygen sensor).
See DAQUtils documentation to learn more about how to add custom map for a variable and a desired function to process the data using PostProcessData.
from firepydaq.utilities.PostProcessing import PostProcessData

datapath = '../tests/Example_ExpData/20240612_1717_ExampleFireData_Testing_Dushyant.parquet'
formulaepath = '../tests/Example_Config_Formulae/Processing_formulae.csv'
configpath = '../tests/Example_Config_Formulae/20240329_1354_CalorimetryWLaser_Dushyant.csv'

PPData = PostProcessData(datapath = datapath, configpath = configpath, formulaepath = formulaepath)
PPData.ScaleData()
PPData.UpdateData(dump_output = False)
plot_collected(PPData)
Importing FIREpyDAQ v.0.1.1